|
     |
You can run Tectia Server in debug mode to gather information which is useful when troubleshooting any connection or authentication problems.
Tectia Server control utility ssh-server-ctl(8) can be used to troubleshoot running service with debug command options that can be used to enable debug mode for the ssh-server-g3, servants and/or user SFTP server processes.
![[Note]](images/note.gif) | Note |
|---|---|
Do not leave the server running in debug mode unnecessarily. Debugging slows down the performance of the server. |
The following sections give instructions on activating the debugging on Unix and on Windows platforms.
To enable debug mode without restarting Tectia Server, run the following commands as privileged user:
Before enabling debug, check the status of the currently running server:
# ssh-server-ctl status -v
Log debug to a file, for example:
# ssh-server-ctl debug log-file /tmp/server-debug.txt
Enable debug mode. In this example, for all server processes with global debug level 4:
# ssh-server-ctl debug set 4
If higher <debug_level> is needed, it is recommended to use
"module=level,module*=level,..." filter to enable debug only on
intended modules. See next section for details on filter.
After reproducing the issue, remember to disable debug mode:
# ssh-server-ctl debug clear
This changes debug level to 0 and also removes the debug hook for the debug log file.
Check the status of the currently running server:
# ssh-server-ctl status
Verify from the output that 'Debug level' is 0. If Debug level is not displayed at all, the master ssh-server-g3 process in question has never had debug enabled.
| Note |
|---|---|
Stopping the service does NOT disable debug. If the service has already been restarted, then clear the debug settings also from the previous, retired service as it may still have retired server processes: # ssh-server-ctl --old status # ssh-server-ctl --old debug clear |
To view all debug commands available for
ssh-server-ctl:
# ssh-server-ctl debug --help
To start Tectia Server in debug mode, follow these instructions:
Stop the server, if it is currently running. Use the start-stop script described in Starting and Stopping the Server:
Start the server executable by entering the following command with root privileges:
# ssh-server-ctl start --server-log-file /tmp/server-debug.txt \
--server-debug-level <filter> | Note |
|---|---|
Recommended on Linux with systemd and on SELinux-enabled systems where manually starting the service is not supported. |
Or manually, on other Unix systems:
# /opt/tectia/sbin/ssh-server-g3 -D<filter>In the command:
filter is an expression that takes the following syntax:
"module=level,module=level,..." for example
"*Cert*=4,*Ocsp*=7".
In case you define a filter with
several modules with overlapping names, list the modules in increasing levels of
detail (highest level last).
module is an optional expression. It can be used to restrict the
debug output to only a particular module or to allow the use of varying debug levels
for different modules, for example "2,SecShServer*=4" or
"6,*Nio*=0"
level is an integer from 0 (no debug info) to 99 that specifies the
desired amount of debug information.
| Note |
|---|---|
The levels 1-9 are the recommended debug levels. The higher the number, the more detailed the troubleshooting output will be, and the more the debugging will affect performance. |
The following example command starts the server with a global debug level 4 and outputs the debug information to the screen:
# /opt/tectia/sbin/ssh-server-g3 -D4
The following example command
starts the server listening on port 777, using only 1 servant process, and using filters
to display level 2 output from everything else, but level 4 output from modules starting
with "SecShServer". The debug output is redirected to file
server.log.
# /opt/tectia/sbin/ssh-server-g3 -l 777 -n 1 -D"2,SecShServer*=4" > server.log 2>&1
To view all options available for ssh-server-g3, enter the following
command:
# ssh-server-g3 -h
To enable debug mode without restarting Tectia Server, run the following commands as privileged user:
Start Windows PowerShell with Run as Administrator
and change to the "<INSTALLDIR>\SSH Tectia Server\", for example:
cd "C:\Program Files (x86)\SSH Communications Security\SSH Tectia\SSH Tectia Server\"
Before enabling debug, check the status of the currently running server:
.\ssh-server-ctl status -v
Log debug to a file, for example:
.\ssh-server-ctl debug log-file C:\server-debug.txt
Or alternatively, View Troubleshooting Log if you wish to both monitor and store the log contents to a file simultaneously:
.\ssh-server-debugger
Enable debug mode. In this example, for all server processes set global debug level 4 and modules starting with "SshUser" higher level 9:
.\ssh-server-ctl debug set "4,SshUser*=9"
This <debug_level> is suitable for user authentication.
The amount of debug can also be reduced by disabling some of the other modules by
setting them to 0 in
"module=level,module*=level,...". See previous section for details
on filter.
After reproducing the issue, remember to disable debug mode:
.\ssh-server-ctl debug clear
This changes debug level to 0 and also removes the debug hook for the debug log file if it was used.
Check the status of the currently running server:
.\ssh-server-ctl status
Verify from the output that 'Debug level' is 0. If Debug level is not displayed at all, the master ssh-server-g3 process in question has never had debug enabled.
To view all debug commands available for ssh-server-ctl see:
.\ssh-server-ctl debug --help
| Note |
|---|---|
On Windows, to get debug output from the Windows server using Tectia Server Configuration GUI, you need to have appropriate Windows policy rights to have the "Debug programs" policy enabled. The admin user has the policy enabled by default. |
To start the Tectia Server in debug mode, follow these instructions:
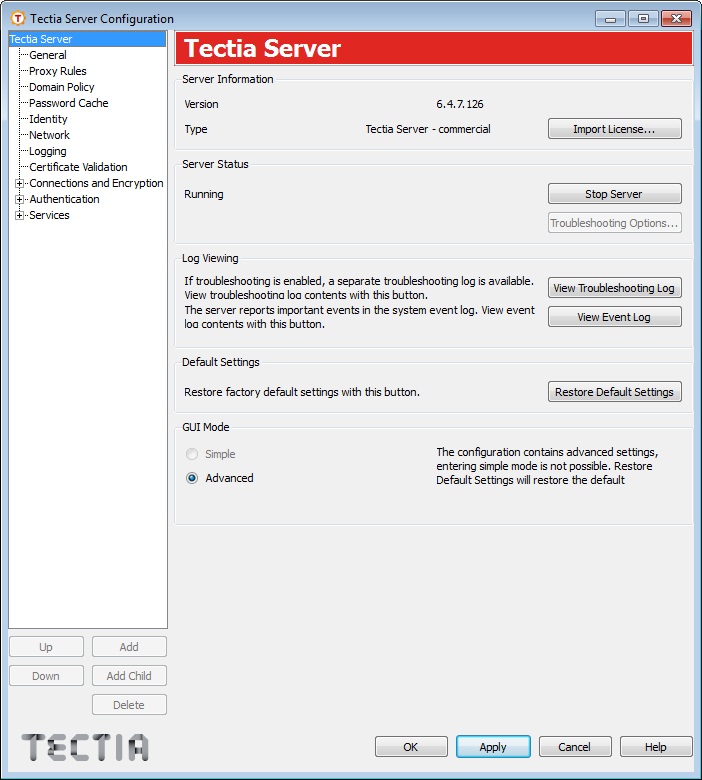
Open the Tectia Server Configuration tool from the Start menu by selecting: Start → Program Files (x86) → SSH Tectia Server → SSH Tectia Server Configuration
The following window appears:
Stop the server, if it is currently running, by clicking the Stop Server button. This will enable the Troubleshooting Options button.
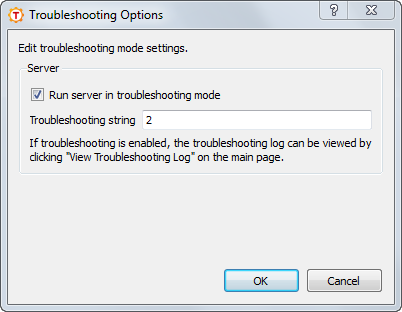
Click the Troubleshooting Options button and
select the Run server in troubleshooting mode option. Additionally,
you can go under Troubleshooting string and specify the level of
information to display. The string can be a filter or a number from 1 to
99 (the default is 2).
The higher the number, the more detailed the troubleshooting output will be, and the more
the debugging will affect performance.
| Note |
|---|---|
The levels 1-9 are the recommended debug levels. Important: if
In case you define a filter with several modules with overlapping names, list the modules in increasing levels of detail (highest level last). |
Click OK to close the Troubleshooting Options window.
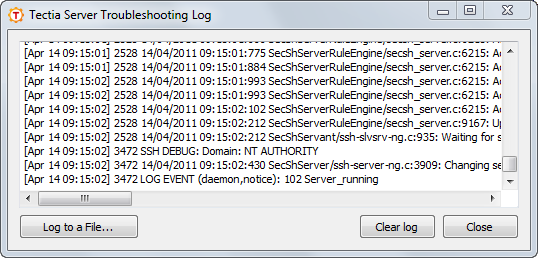
Click the View Troubleshooting Log button to open a window where the troubleshooting information will be displayed.
You can store the log contents into a file by clicking the Log to a File button. Define the file name and location as applicable.
Start the server by clicking the Start Server button.
The troubleshooting information will now be displayed in a window named Tectia Server Troubleshooting Log.
After troubleshooting the server follow these steps to disable the troubleshooting:
Stop the server by clicking the Stop Server button.
Click Troubleshooting Options and unselect the Run server in troubleshooting mode option.
Start the server by clicking the Start Server button.
The secure file transfer process (sft-server-g3) is debugged together with the Tectia Server, and the same debug level that is set for Tectia Server (ssh-server-g3) is used for both processes by default.
Tectia Server control utility ssh-server-ctl can be used to troubleshoot running service with debug command. There are file transfer related options that can be used to enable debug mode for the user SFTP server processes without the need to set any environment variables.
ssh-server-ctl debug set "4;sftpfile=/tmp/sftp_debug_%U.txt"
This will create user-specific SFTP debug logs on the server-side. There are two SFTP
related debug level options
sftpfile=<filename> and
sftpdebug=<level>. If only sftpdebug is defined, the debug
messages are sent to the ssh-servant-g3 server process.
For more information on SFTP debug options, please see the ssh-server-ctl ssh-server-ctl(8) and ssh-server-config(5) man pages.
Alternatively, the environmental variables can be used to redirect the
sft-server-g3 debug messages, that are by default
sent to the standard error, that goes also to the SFTP client. If you want to forward the
sft-server-g3 debug messages into a file and not to the client, you can
add the following two environment variables affecting the secure file transfer user into the
/etc/environment file on Unix and into the user-specific environment
variables on Windows:
SSH_SFTP_DEBUG defines the debug level that controls the messages that the sft-server-g3 process will be showing while executing. This variable can be used when no debug level has been set for the sft-server-g3 process. The value can be for example:
SSH_SFTP_DEBUG=SftpLibServer=80,SftpLibStageFsFile=80
If debug level is set for ssh-server-g3 this variable will be ignored.
SSH_SFTP_DEBUG_FILE defines the file where the debug messages from the sft-server-g3 will be printed. This variable can be used when no debug level has been set for the sft-server-g3 process. The value can be for example:
SSH_SFTP_DEBUG_FILE=/tmp/sft_debug.txt
If this variable is not defined, the messages will be sent to standard error as normally, and the SFTP client will receive them.
If debug level is set for ssh-server-g3 this variable will be ignored.
| |