|
     |
The Connection Broker is a component included in Tectia Client. The Connection Broker handles all cryptographic operations and authentication-related tasks for Tectia Client and the command-line tools sshg3, scpg3, and sftpg3.
If the verbose level output explained in Gathering Basic Troubleshooting Information does not solve your problem, set the existing running Broker to debug mode. Existing open connections will remain up and running, which is relevant on multiuser systems or when there are lots of automated scripts running at the same time. You will also get a debug log from new connection attempts.
To set the Connection Broker to debug mode, follow these instructions:
Open a shell (on Unix) or command prompt window (on Windows).
If you already have an existing Connection Broker, skip this step. If you do not have an existing Connection Broker, run the following command:
$ ssh-broker-g3
Set the Connection Broker to debug mode by running the following command:
$ ssh-broker-ctl debug --log-file=<logfile><debug-level>
In the command:
logfile specifies the file to which the debug
output will be directed
debug-level is an integer from 0 (no debug info) to 99 that
specifies the desired amount of debug information.
![[Note]](images/note.gif) | Note |
|---|---|
The recommended debug levels are 1-9. The higher the number, the more detailed the troubleshooting output will be, and the more the debugging will affect performance. |
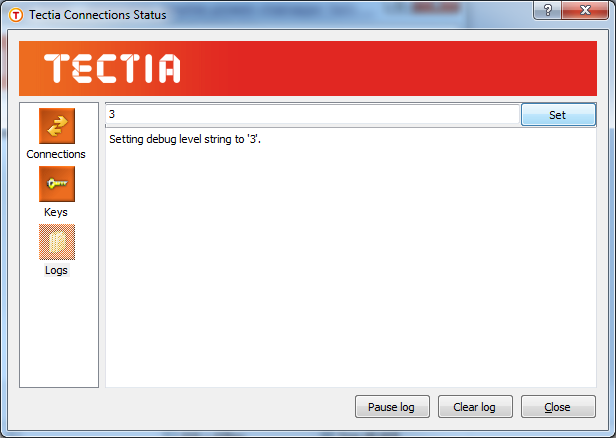
On Windows, you can set the debug mode also in the Logs view in the Tectia Connection Status window. To open the Tectia Connection Status window, right-click the Tectia icon in the Windows taskbar notification area and select Status.
The following example command sets the Connection Broker debug mode to
level 4 and outputs the debug information to a log file named
broker.log:
$ ssh-broker-ctl debug --log-file=broker.log 4
Connect to a server using one of the clients:
$ sshg3 user@host
View the debug information for the connection in the
broker.log file.
On Unix, you can display the debug output also by using the command
line tools with argument -D. For example, the following command
will display the debug output with a debug level 2:
$ sftpg3 -D2 user@host
On Windows, besides the command line tools, you can display the debug output also in the Tectia Connection Status window.
| Note |
|---|---|
After you have collected the debug output, remember to disable Tectia Client's debug mode, since debugging slows down the performance. |
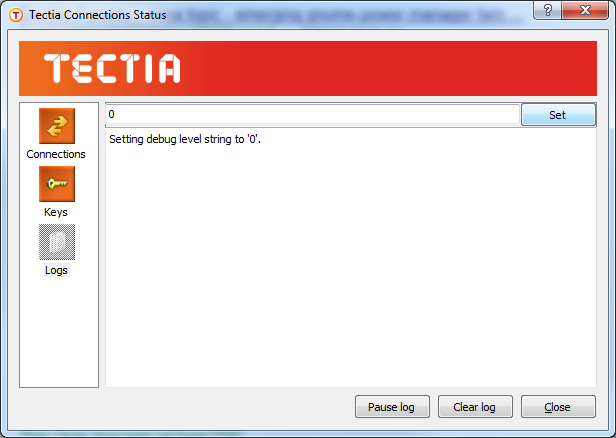
On Unix and Windows, the debug mode is disabled with the following command:
$ ssh-broker-ctl debug --clear
On Windows, the debug mode can be also disabled by setting the debug level back to 0 in the Tectia Connection Status window, as shown in Figure 7.3
| |
Copyright  2016 SSH Communications Security Corporation
This software is protected by international copyright laws. All rights reserved.
Contact Information